SimPhoNy
Mayavi tools are available in the simphony library through the
visualisation plug-in named mayavi_tools.
e.g:
from simphony.visualisation import mayavi_tools
Visualizing CUDS
The show() function is available to
visualise any top level CUDS container. The function will open a
window containing a 3D view and a mayavi toolbar. Interaction
allows the common mayavi operations.
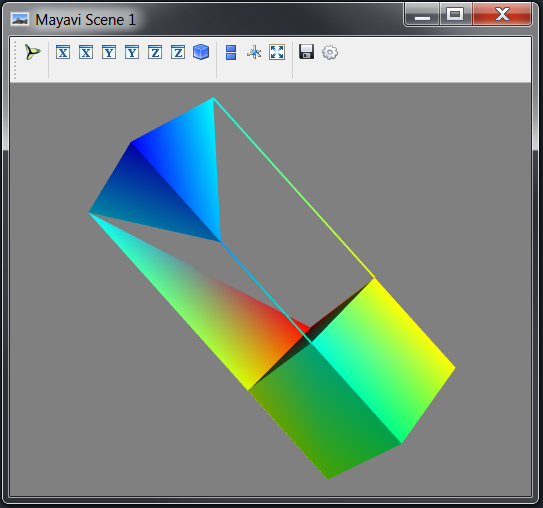
Mesh example
from numpy import array

from simphony.cuds.mesh import Mesh, Point, Cell, Edge, Face
from simphony.core.data_container import DataContainer


points = array([
    [0, 0, 0], [1, 0, 0], [0, 1, 0], [0, 0, 1],
    [2, 0, 0], [3, 0, 0], [3, 1, 0], [2, 1, 0],
    [2, 0, 1], [3, 0, 1], [3, 1, 1], [2, 1, 1]],
    'f')

cells = [
    [0, 1, 2, 3],  # tetra
    [4, 5, 6, 7, 8, 9, 10, 11]]  # hex

faces = [[2, 7, 11]]
edges = [[1, 4], [3, 8]]

mesh = Mesh('example')

# add points
uids = [
    mesh.add_point(
        Point(coordinates=point, data=DataContainer(TEMPERATURE=index)))
    for index, point in enumerate(points)]

# add edges
edge_uids = [
    mesh.add_edge(
        Edge(points=[uids[index] for index in element]))
    for index, element in enumerate(edges)]

# add faces
face_uids = [
    mesh.add_face(
        Face(points=[uids[index] for index in element]))
    for index, element in enumerate(faces)]

# add cells
cell_uids = [
    mesh.add_cell(
        Cell(points=[uids[index] for index in element]))
    for index, element in enumerate(cells)]


if __name__ == '__main__':
    from simphony.visualisation import mayavi_tools

    # Visualise the Mesh object
    mayavi_tools.show(mesh)
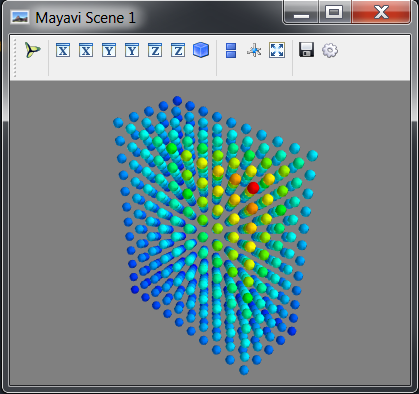
Lattice example
import numpy

from simphony.cuds.lattice import make_cubic_lattice
from simphony.core.cuba import CUBA

lattice = make_cubic_lattice('test', 0.1, (5, 10, 12))

for node in lattice.iter_nodes():
    index = numpy.array(node.index) + 1.0
    node.data[CUBA.TEMPERATURE] = numpy.prod(index)
    lattice.update_node(node)


if __name__ == '__main__':
    from simphony.visualisation import mayavi_tools

    # Visualise the Lattice object
    mayavi_tools.show(lattice)
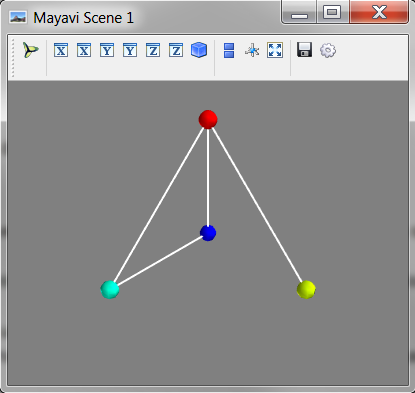
Particles example
from numpy import array

from simphony.cuds.particles import Particles, Particle, Bond
from simphony.core.data_container import DataContainer

points = array([[0, 0, 0], [1, 0, 0], [0, 1, 0], [0, 0, 1]], 'f')
bonds = array([[0, 1], [0, 3], [1, 3, 2]])
temperature = array([10., 20., 30., 40.])

particles = Particles('test')
uids = []
for index, point in enumerate(points):
    uid = particles.add_particle(
        Particle(
            coordinates=point,
            data=DataContainer(TEMPERATURE=temperature[index])))
    uids.append(uid)

for indices in bonds:
    particles.add_bond(Bond(particles=[uids[index] for index in indices]))


if __name__ == '__main__':
    from simphony.visualisation import mayavi_tools

    # Visualise the Particles object
    mayavi_tools.show(particles)